Concept Information
Understanding the Recently Run Reports List
Report Definitions Import/Export
Related Tasks
Accessing a Recently Run Report
Defining Report Style and Page Orientation
Defining Headings and the Footer in a Report
Selecting a Report's Date Range
Creating Comparisons with Denominators
Reference Materials
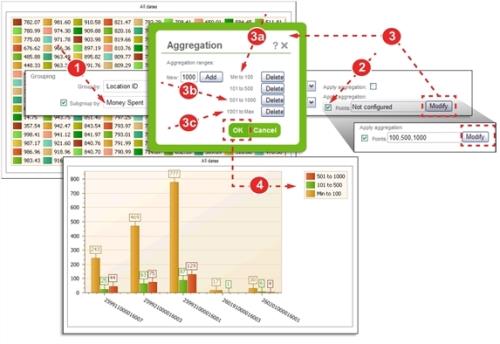
Grouping Numeric Fields into Ranges
Aggregation is used to group numeric fields into ranges. Most frequently, it will be used for Age or Money Spent. For example, if Money Spent is used to subgroup the cases per location you will see a very crowded and hard-to-read graph, because each case probably has a unique dollar amount. To keep your graphs clutter free, consider grouping the Money Spent field into multiple categories. In the example below, four categories are used: 0 to $100, greater than $100 to $500, $501 to $1000 and greater than $1001.
Prerequisites: You must have the 'Allow Access to Report
To use aggregation for numeric fields:
- In the Report Details section of the Report Editor, select a numeric field for the Group by or Subgroup by field.
- Check the Apply aggregation box.
- Click Modify. The Aggregation
- Type the end value for the first range, in this example
100, and click Add. The Min and Max groups appear. - Type the end value for the next range, in this example
500, and click Add. A third group appears and the Max group is recalculated. - Repeat until all groups have been defined.
- Type the end value for the first range, in this example
- Click OK. With aggregation set, each location can have up to four bars – one for each of the defined ranges. This makes for a readable, meaningful chart.
- Note: In the example graphic, a report was generated without aggregation. Because there is so much variation in the Money Spent field, the Legend takes up the entire graph area.