Concept Information
Understanding the Recently Run Reports List
Report Definitions Import/Export
Related Tasks
Accessing a Recently Run Report
Defining Headings and the Footer in a Report
Grouping Numeric Fields into Ranges
Selecting a Report's Date Range
Creating Comparisons with Denominators
Reference Materials
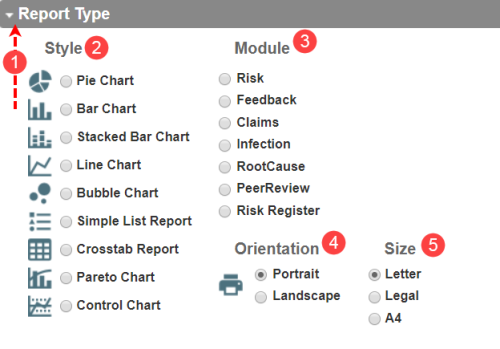
Defining Report Style and Page Orientation
The Report Type section of the Report Editor is used to define the report style and page orientation. If you have already generated the report as a Chart, changing the style to Simple List Report or Crosstab Report will reset the values entered in the Report Details section (Report Details Section).
To complete the Report Type section:
- Expand the Report Type section by clicking the triangle next to the section title, if necessary.
- Select a Style (Report Types). The fields and format of the Report Details section changes based upon your selection.
- Select a Module.
- Select an Orientation:
- Portrait – the default setting is best used for simple list reports or charts that also include the Data Grid below.
- Landscape – ideal for charts where many values are shown on the x-axis. This orientation generally allows for a larger chart, which is easier to read when the chart contains many values.
- (For Printing) Choose a Size option (Letter, Legal or A4).