Concept Information
Main toolbar in Report Designer
Standard Controls Toolbar in the Report Designer
Properties Panel in the Report Designer
Field List Panel in the Report Designer
Report Explorer Panel in the Report Designer
Design Surface in the Report Designer
Using Bands in the Report Designer
Related Tasks
Navigating the Report Designer
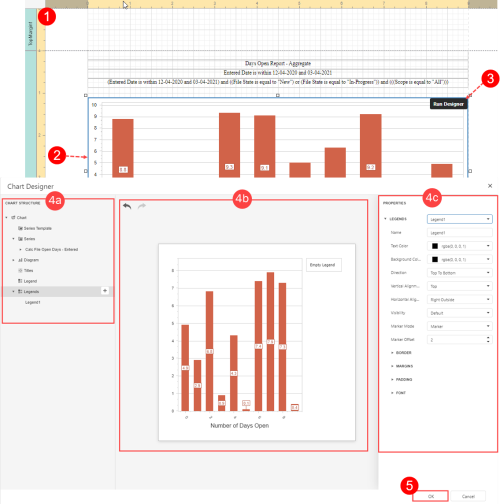
Navigating the Chart Designer
The Chart Designer provides a user-friendly interface for updating chart components, such as the axes, chart titles, legend and more.
To edit a component using the Chart Wizard:
- Open a report in the designer (not shown, see Editing a Report with Report Designer).
- Click on the chart.
- Click the Run Designer link at the top right corner of the chart. The Chart Designer
-
The Chart Designer consists of three main parts:
-
Chart Structure tree - enables you to explore and manage a structure of a chart and its elements. When you click a chart element in the tree, the designer's Properties panel displays settings of this element. To add a new chart element, (e.g., series, diagram, title), click the element and then click the Add (+) plus button next to it. To delete an element, click the Remove button next to it.
-
Chart Layout area displays the preview of the created chart. Note: This area also shows Undo/Redo options to reverse the most recent action or perform the action you have previously undone.
-
Properties panel - allows you to view and change settings of a chart and its elements. Changing any property updates the chart layout to display the current state.
-
-
Click Ok to close the Chart Designer and apply your changes.