Concept Information
Main toolbar in Report Designer
Standard Controls Toolbar in the Report Designer
Field List Panel in the Report Designer
Report Explorer Panel in the Report Designer
Design Surface in the Report Designer
Using Bands in the Report Designer
Related Tasks
Navigating the Report Designer
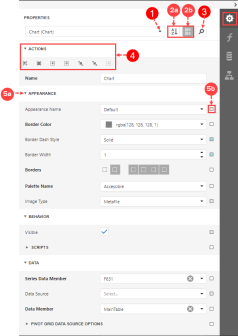
Properties Panel in the Report Designer
The Properties panel provides a quick way to access and customize the report and modify the many attributes of each report element. When you select an element from the Report Layout panel (Design Surface in the Report Designer), all the attributes you can modify are displayed in this panel. To modify the Chart properties, you may also use the Chart Wizard (Navigating the Chart Designer).
To open the Properties panel, click on the Properties icon. The Property Grid panel is made up of the following:
- Element List – use the drop-down list to select the report element whose attributes you wish to change. The selected element is highlighted on the report layout.
- Note: Select an element in the Report Layout panel to view it properties.
- Switch Views – the list of attributes can be sorted two different ways:
- Alphabetical – sort the list of attributes in ascending order.
- Search - click on the Search icon to display/hide the search field. When you type in the search box, the Properties panel filters the list of available properties and highlights the search string in the records.
- Actions - when you use the categorized mode, the Properties panel contains an Action group that provides the most commonly used actions for the selected report element. In the example below, the chart element is selected and the Action section offers options for arranging the position of the chart within the report layout.
- Properties – each record consists of a property's caption, a value editor, and an optional property marker. To change a property's value, select the property and specify its value in the editor:
- Expand/Collapse – some properties have multiple attributes. Click the header to view them all.
- Property marker – The property marker indicates if the property's value was changed. If a property stores a default value, the marker is gray. If a property's value was changed, the marker becomes white. If a report style supersedes a property's value, the marker is light blue. This applies to appearance properties (e.g., BackColor, Font, Borders). Note: You can click the property marker and select Reset in the popup menu to restore the default property values.