Concept Information
Related Tasks
Adding a Report to Your Favorites List
Modifying Report and Snapshot Properties
Modifying Report Snapshot Properties
Reference Materials
Generated Report Attributes
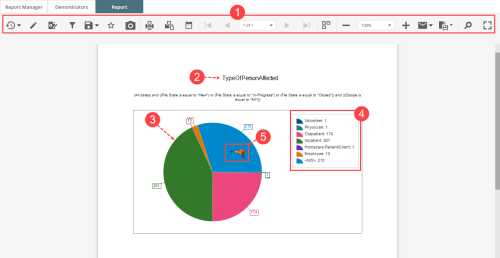
Generated reports appear in the Report tab of the Report
- Report Toolbar (Report Toolbar) – the dynamic toolbar appearing above the report is used to make modifications, save, print, switch between reports, and distribute the report to other users. Some buttons may be hidden based on the state of the report.
- Titles – when the report is generated from the Question Wizard, the titles are automatically defined. Using the Report Editor or Report Designer, you can add your own titles.
- Chart, Graph or Table – the visual representation of the data selected for the report appears here. There are seven report formats to choose from (Report Types).
- Legend – a description of the graphical components that make up the chart. The visibility, placement and contents are configurable through the Report Editor (Report Details Section).
- Data Grid – an optional component of the report that can be turned on (Modifying Report Parameters) to show a tabular view of the data used to create the chart or graph.
- Drill Pointer (Drilling into Report Details) – used to “drill” into the next layer of the report. For example, a slice representing “N/S” Person affected can be broken down by a number of fields, including location, reporter, date entered or much more.