Defining Report Data
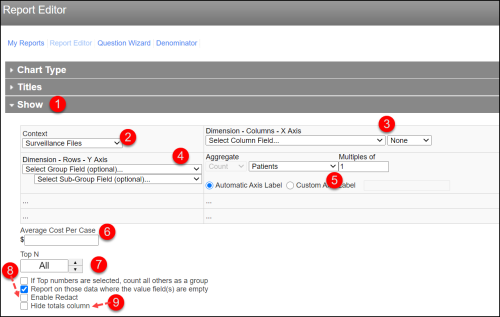
The Show section of the Report Editor defines the fields used to generate the report, allowing you to choose the x- and y-axis fields, group the data and aggregate it as you see fit. Based on the type of report selected, one or more fields of this section may be disabled; in fact, for the Line Listing report, the entire section is hidden. For detailed descriptions of all the fields in this section, see Show Section Field Descriptions.
To define report data:
- Access the Report Editor (Creating and Modifying Reports) and expand the Show section.
- Select a ContextThe type of records that will be examined for reporting purposes, such as surveillance files, surgical procedures, central line insertions, etc. The values contained in other reporting drop-down lists change based upon the selected Context.from the list. The context defines where the report data is pulled from and the values in the rest of the lists change based on your selection.
- Choose the X Axis dimension and specify the time grouping, which is only active for certain chart types.
- If desired, select the Y Axis grouping and sub-grouping values.
- Use the Aggregate settings to determine how the records included in the report will be counted.
- To turn the y-axis values into dollars, enter the Average Cost Per Case.
- To limit the series shown in the report, use the Top N options.
- To censor sensitive information that will appear in the Y and X axis, check Enable Redact.
- To hide the totals column in Staff Health reports, check Hide totals column.
- For more details on the Report Editor, see: