Show Section Field Descriptions
The table below describes how the various fields of the Show section affect the report:
|
Type |
Description |
Sample |
|
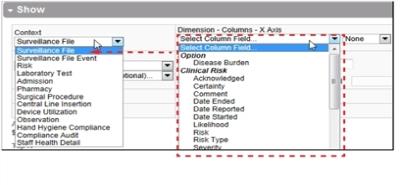
Context |
You have access to every reportable data element within the system but there are some requirements that help to produce a sensible report. The main one is the context of the report, which specifies the type of records upon which the report will be based. Specifying this context limits the other list options presented in the Report Editor to only the valid options available. Selecting |
|
|
This field is required for all reports. For line charts, it is used to define the date field used along the x‑axis. For all other charts, it is used to define the subject of the report. In this example, a Simple Line Chart (Report Type Descriptions (RL6:Infection)) was generated with the Column field set to This field is used in conjunction with the Time Grouping (Time Grouping), Group and Sub-Group (Sub-Group Field) fields to |
|
|
|
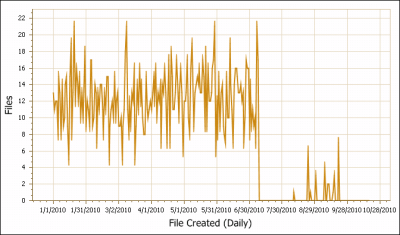
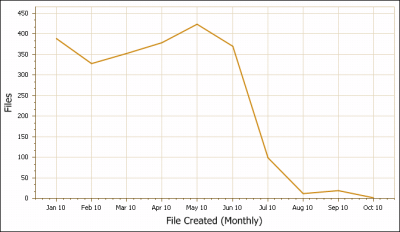
This field is only used for line charts. It determines how often records that are included in the report are tallied. The values available are When defining the report Start and End date (Selecting the Date Range), consider the selection you made here; if Daily was selected, a report that covers a large time span will be difficult to read (Column Field (X Axis)). In this example, the time grouping has been changed from Daily to Monthly, producing a chart that is much easier to read. |
|
|
|
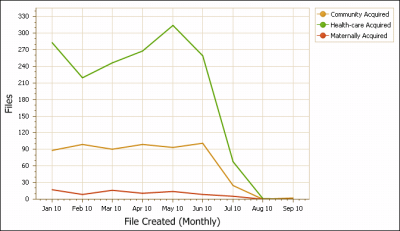
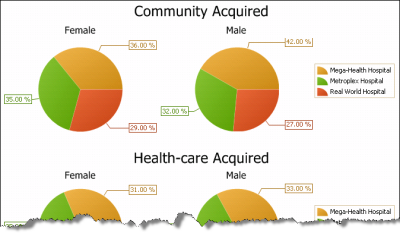
The group field is not a required field, but proves helpful when you want to For line charts, as shown here, selecting group fields will add more lines to chart. When the Group field is set to For bar charts, multiple series are grouped and displayed along the x‑axis. For pie charts, multiple graphs are produced for each value returned for the Group field. Note: If you just want to produce a count of all the values recorded, select the |
|
|
|
The Sub-Group field is only active when a Control, Pie or Rate Table chart type is selected (Selecting the Chart Type). This provides a way to generate multiple charts on a single report. In this example, the Column value was set to Reports that do not fit on the first page of the report can be accessed through the Report Toolbar (See Report Toolbar Buttons). |
|
|
|
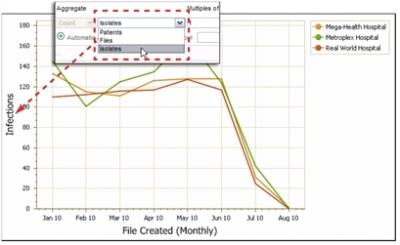
You should also consider what it is that you want to count for the report. Aggregate options vary depending on the report context. One example is counting patients versus counting infections. A patient with multiple infections may skew the results; in order to work against this, each patient is counted only once during each reporting period by aggregating against patients rather than infections. In some situations, it may be more appropriate to count the number of infections, even if this includes counting the same patient more than once. |
|
|
|
Multiples of |
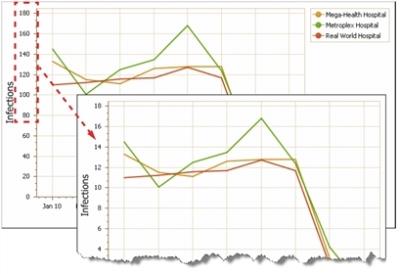
When aggregating large numbers, it may be useful to apply a multiplier when reporting on values. Line days, for example, are often reported in thousands of line days. In this case, enter the factor 1000 into the multiplier to view the value multiplied by a factor of 1000. Another way to think of this field is that is allows you to adjust the scale of the y-axis. As you can see in this example, the Multiples of field was changed from Note: If you are entering a value less than one, you must include the leading zero. Entering |
|
|
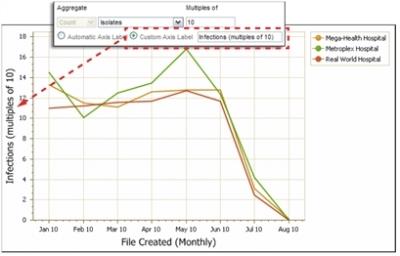
The default option is Automatic Axis Labels, which adds a default title to the graph based on the aggregate field (Aggregate Field) selected. For most charts, this label appears along the y‑axis. Note: For rate tables, the label only appears in the upper-left cell when you specify the label name. Pie charts do not have axis labels. To enter your own title, select the Custom Axis Label radio button. Then type the value that should appear along the axis into the adjacent field. |
|
|
|
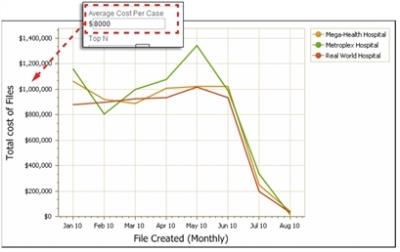
An effective way of gaining some people's attention is to report in dollar values. If a costing study has revealed an average cost per case for the measure being reported, it can be used to translate the number of cases into a total cost. Enter the dollar amount into the Average Cost Per Case field without any commas or decimal places. When the report is generated, the y‑axis is converted into dollar amounts and the label is updated if the automatic label option is selected. |
|
|
|
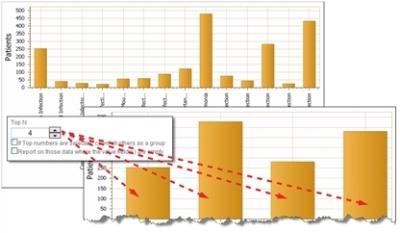
Some fields may have hundreds of options to choose from (such as organism) – many of which represent a very small percentage of the total. It is possible to specify how many of the most frequent values to include in the report by using the Top N field. Click the Up or Down arrows to adjust the number of series – up to |
|
|
|
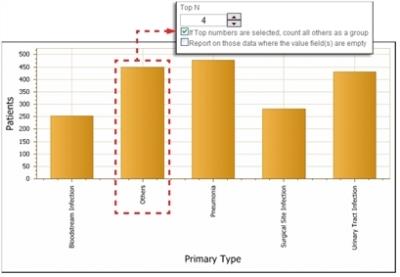
If Top numbers are selected, count all others as a group |
Values that do not appear in the Top N can be grouped together and included in the report by checking this box. |
|
|
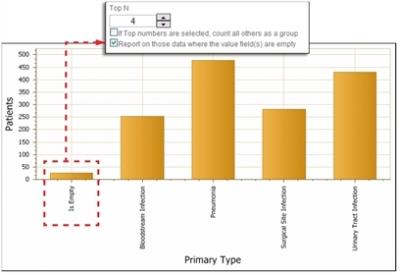
Report on those data where the value field(s) are empty |
If the report needs to include a count of the number of times nothing has been specified for the field upon which the report is based, check this box. This field should be checked when a filter (Adding Filters) looking for empty values has been specified. |
|
|
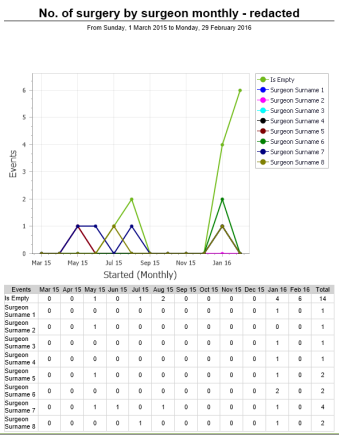
Enable Redact |
Check this box to hide sensitive data, i.e. names, locations, etc., from appearing in a report. This feature allows published reports to be easily distributed without having to directly identify specific information. It is compatible with existing reports and redacted details are changed to its field name and a number. It is recommended to duplicate an existing report with redacted fields as opposed to overwriting or modifying an existing report. |
|
|
Hide totals column |
Check this box to hide the totals column in Staff Health reports. |
|