Concept Information
Related Tasks
Viewing Survey Results in a Chart
You can view aggregate results represented in a bar chart for every question in the survey to see overall responses.
Prerequisites: You must have the 'Patient Experience' function enabled for your role.
Note: If there are no responses for a question, there will be no results on the chart.
- In the Patient Experience page, click on the Surveys tab.
- Locate and click on the survey you want (not shown).
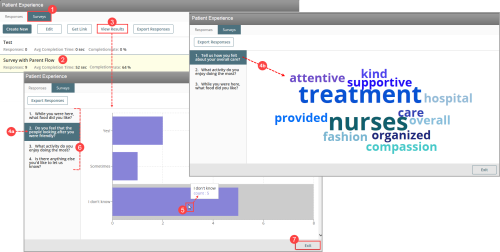
- Click View Results. The Survey questions are displayed in the left panel.
- Select a question:
- For multiple choice and rating questions, a bar chart is generated to show the total number of respondents (i.e. the horizontal x-axis) who selected each answer (i.e. the vertical y-axis).
- For free text questions, a summary of the top 20 words in all free text answers is displayed in a word cloud chart. (Tip: If you click the free text question again, the word cloud is generated in a different arrangement.)
- (For multiple choice or rating questions) Hover over the a bar to show the answer and the count (i.e. the total number of times this answer was selected).
- Select other questions to see the results.
- Click Exit to return to the Surveys tab.
You can export all survey results to a CSV![]() A Comma Separated Values file. Each row in the file represents a record. When opened in Microsoft Excel®, each value appears in its own cell; when opened in Notepad®, however, the record’s values are separated by commas. file by clicking the Export Response button above the chart. See Exporting Survey Responses for more information.
A Comma Separated Values file. Each row in the file represents a record. When opened in Microsoft Excel®, each value appears in its own cell; when opened in Notepad®, however, the record’s values are separated by commas. file by clicking the Export Response button above the chart. See Exporting Survey Responses for more information.
Note: If a question has been edited, the left panel will show the updated question and the right panel will show responses submitted before and after the edit. For multiple choice questions, if an answer option is edited (e.g. "I don't know" changed to "I'm not sure", the chart will display two separate bars: one for responses submitted before the edit and another for responses submitted after the edit.