Related Tasks
Reference Materials
Generated Reports in RL6:Infection
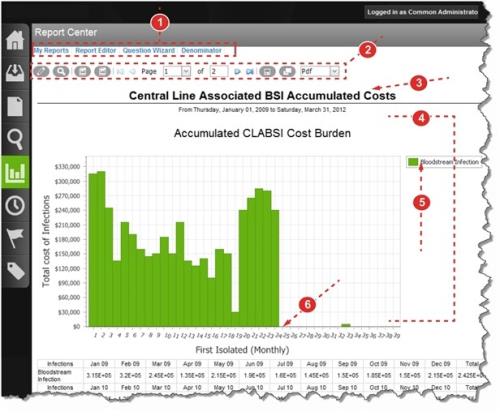
Generated reports are embedded into the content area of the Report
- Navigation Links – these always display, with all becoming active when report is generated:
- My Reports – returns you to list of reports.
- Report Editor – opens the page used to create reports (Creating and Modifying Reports).
- Question Wizard – opens the feature used to create reports to
- Denominator – create or modify entries on Denominator page (Setting a Denominator).
- Report Toolbar (Report Toolbar Buttons) – the toolbar appearing above the report is used to edit, search, print, export or save the report to your computer.
- Titles – details from the Titles section of the Report Editor are used to configure the title, shown here, and the subtitle. The date range is automatically added to the report and for some report types, the Group Field appears above the chart.
- Chart, Graph or Table – the visual representation of the data selected for the report appears here. There are nine to choose from (Report Type Descriptions (RL6:Infection)).
- Legend – a description of the graphical components that make up the chart.
- Data Grid – an optional report component that shows a tabular view of the data.