Concept Information
Related Tasks
Creating a Report with Report Designer
Editing a Report with Report Designer
Making Common Changes with the Report Designer
Adding Borders and Shapes to a Report
Changing Font Size, Color and Type
Changing the Page Orientation and Modifying the Grid
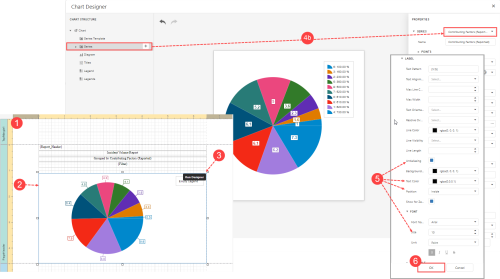
Modifying Point Labels
Point labels are used to show the exact value represented by the graphical elements, such as a bar or pie slice. By default, these labels appear outside of the graphical element; in some cases, repositioning the labels to the interior means that there is more space to display the chart. Other attributes, such as font size,
To modify point labels:
- Open a report in the designer (not shown, see Editing a Report with Report Designer).
- Click on the chart.
- Click the Run Designer link at the top right corner of the chart. The Chart Designer
- Go to the Chart Structure tree on the left:
- If the Group By and SubGroup properties were defined for the report, click Series Templates.
- If only the Group By property was defined for the report, click Series. Then, in the Properties panel at the right, expand the Series section and select the field by which the data is grouped (e.g., Contributing Factors).
- Scroll down and make modifications on the Label and Font categories. In this example:
- The Position was set to
Inside. - Antialiasing, which smooths the appearance of the text, was checked.
- The
- The Font was made bold and increased to
10pt. Note: In this example, additional modifications were made: In the Border category, Visible was set to False to remove the border and Fill Mode was set toEmptyto remove the background
- The Position was set to
- Click the Ok button to apply your changes to the chart.