Concept Information
Related Tasks
Creating a Report with Report Designer
Editing a Report with Report Designer
Making Common Changes with the Report Designer
Adding Borders and Shapes to a Report
Changing Font Size, Color and Type
Changing the Page Orientation and Modifying the Grid
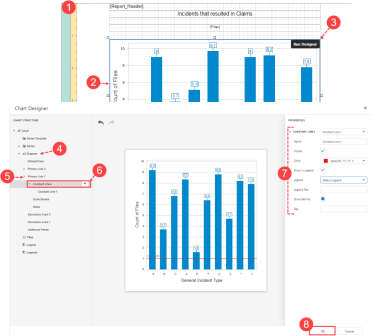
Adding a Constant Line to a Bar Chart
The Chart Wizard allows you to add one or more static constant lines to the chart. This provides a quick visual so the report consumer can identify if goals or thresholds are being met or exceeded. In the example below, a constant line that represents the goals for the first quarter has been added to the chart.
To add a constant line to a bar chart:
- Open a report in the designer (not shown, see Editing a Report with Report Designer).
- Click on the chart tag.
- Click the Run Designer link. The Chart Designer
- Chart Structure tree on the left and expand the Diagram section.
- Expand the axis to which you would like to add the constant lines. In this example, the y‑axis is selected.
- Click Constant lines and then click the (+) icon. A new constant line is created and named
"Constant Line 1" by default and added below. - In the Properties panel, the new constant line is selected. Make changes (e.g., name, visibility, color) to the properties as required. Your modifications are displayed in the chart preview area.
- Click the Ok button to apply your changes to the chart.