Understanding Denominator Presentation
Denominators can be compared to numerators in a variety of ways, as described in the table below.
Note: In order to view the table, you must check the Include Table box in the Chart Type section (Selecting the Chart Type).
|
Type |
Description |
Sample |
|
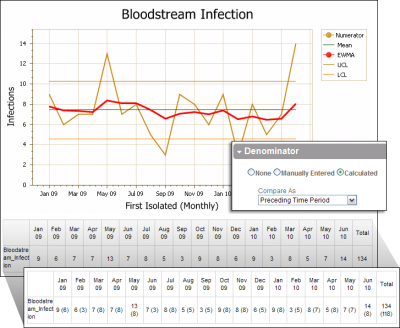
Time Period |
When a
The denominator values are shown in the parenthesis for each cell in the table and are not included in the chart. |
|
|
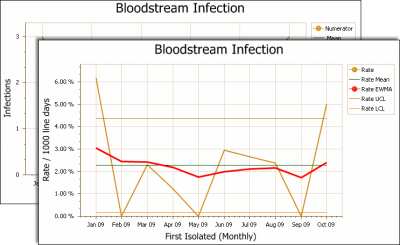
Rate |
Combines the numerator and denominator to calculate a rate. In this example, you see that the y‑axis values are numbers before the denominator is added; when a The y-axis label is also changed to include the word “rate.” In this example, however, a custom axis label has been entered. If a table has been added to the report, the denominator values are shown in parenthesis. |
|
|
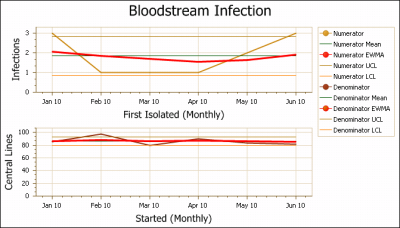
Separate |
If a table has been added to the report, the denominator values are shown in parenthesis. |
|
|
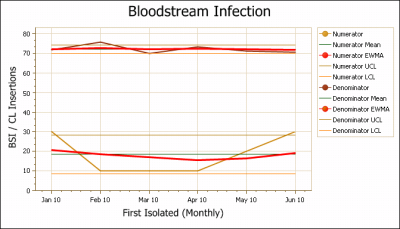
Side By Side |
Plots the denominator on the same chart as the numerator. In this example, the numerator tracks the number of bloodstream infections and the denominator shows the number of central line insertions. Tip: When plotting the numerator and denominator on the same chart, be sure to provide a descriptive axis label (Show Section Field Descriptions). |
|
|
|
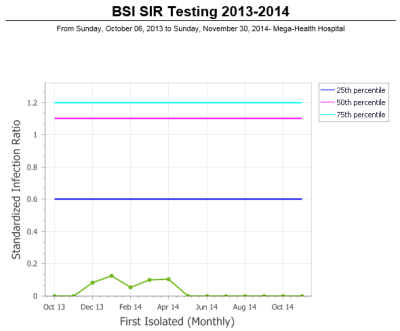
The SIR compares the actual number of HAIs with a baseline population. A SIR greater than 1.0 indicates that more HAIs were observed than predicted; less than 1.0 indicates fewer than predicted (CDC). In this example, the numerator is bloodstream infection associated events and the denominator shows the |
|