
Alert Service Status
The Alert Service status indicates how the alert service is operating.
- Green – the “service is up” and there has been a successful connection to Alert Service API.
- Red – the “service is down” due to a failure to access (i.e. cannot connect, not installed, service stopped) the Alert Service API.
- Orange – the “status unavailable” indicates a failure to connect to RL6 GateWay. Note: the system accesses the Alert Service API through RL6 GateWay
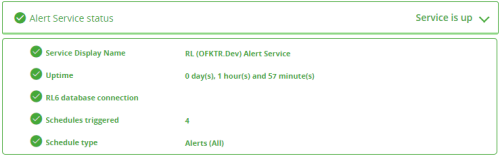
To view additional details, click on the arrow located at the right. A window expands to show information related to the service. See Alert Service Status Details.
|
Alert Service Status details |
Description |
|---|---|
|
Service Display Name |
Shows the service display name that is configured in the SilverSpine.Service.Alert.exe.config file. |
|
Uptime |
Displays the duration of time (days, hours, minutes) in which the service has been running without disruption. If the service is stopped and restarted, the uptime will reset to 0. |
|
RL6 database connection |
Shows the status of the RL6 database connection. A green check mark indicates that the service can access the RL6 database. A red exclamation mark shows when the service cannot access the RL6 database and a brief description of the error is also displayed. |
|
Schedules triggered |
Displays the number of alert schedules triggered in the past 24 hours. |
|
Schedule Type |
Displayed the assigned schedule type (i.e. Alerts |