Report Designer Panels
The Report Designer is made up of a series of panels. When an element is selected in the Report Elements panel, buttons may become active in the Toolbar panel and the attributes listed in the Property Grid panel will change.
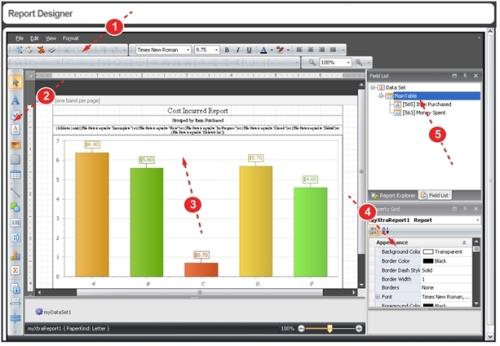
The Report Designer panels are described below:
- Report Designer Toolbar (Report Designer Toolbars) – this panel stretches across the top of the report designer page. Buttons and list boxes become active when report elements are selected or acted upon.
- Tool Box (Standard Controls Toolbar in the Report Designer) – this panel contains the elements you can add to your report.
- Report Layout (Design Surface in the Report Designer) – the largest area of the page where report elements are arranged. When you select an element (or a component within a chart) buttons may activate on the toolbar and the values in the Properties Grid change.
- Property Grid (Properties Panel in the Report Designer) – contains a list of the selected element’s properties that can be modified. The first column is the property name, which may also contain sub-properties (click the
[+]to view). The second column contains the drop-down lists, text boxes and selection panels used to modify the property. - Field List / Report Explorer (Field List Panel in the Report Designer) – this panel contains two views. Field List is the default view, which shows you the metabase fields that are bound to the chart, table or other report elements. The Report Explorer provides a hierarchical view of the elements and sub-elements contained within the report.